PHP Imagick Безье соединяет начальную и конечную точки и не начинается с позиции 0,0
Я попытался создать несколько Безье с Imagick в PHP.
Пока это не работает, моя единственная проблема — как я могу запустить Безье в какой-то другой точке (не в 0,0) и соединить начальную и конечную точки?
любая помощь приветствуется 🙂
Это код, который я использую:
$image = new Imagick();
$image->newImage(500, 500, 'none', 'png');

$bezier1 = new ImagickDraw();
$bezier1->setFillColor('#B42AAF');
$bezier1->setStrokeColor('black');
$bezier1->setStrokeWidth(1);

$bezier2 = new ImagickDraw();
$bezier2->setFillColor('FB9407');
$bezier2->setStrokeColor('black');
$bezier2->setStrokeWidth(1);

$coordinates_1 = Array
(
[0] => Array
(
[x] => 250
[y] => 46
)

[1] => Array
(
[x] => 394
[y] => 166
)

[2] => Array
(
[x] => 316
[y] => 288
)

[3] => Array
(
[x] => 250
[y] => 324
)

[4] => Array
(
[x] => 163
[y] => 299
)

[5] => Array
(
[x] => 163
[y] => 200
)
)

$coordinates_2 = Array
(
[0] => Array
(
[x] => 250
[y] => 123
)

[1] => Array
(
[x] => 437
[y] => 141
)

[2] => Array
(
[x] => 410
[y] => 342
)

[3] => Array
(
[x] => 250
[y] => 405
)

[4] => Array
(
[x] => 169
[y] => 296
)

[5] => Array
(
[x] => 101
[y] => 164
)
)

$bezier1->pathStart();
$bezier2->pathStart();

for($i = 0; $i < count($coordinates_1); $i++)
{
$bezier1->pathCurveToQuadraticBezierSmoothAbsolute($coordinates_1[$i]['x'], $coordinates_1[$i]['y']);
$bezier2->pathCurveToQuadraticBezierSmoothAbsolute($coordinates_2[$i]['x'], $coordinates_2[$i]['y']);
}

$bezier1->pathClose();
$bezier2->pathClose();

$image->drawImage($bezier1);
$image->drawImage($bezier2);

header('Content-Type: image/png');
echo $image;
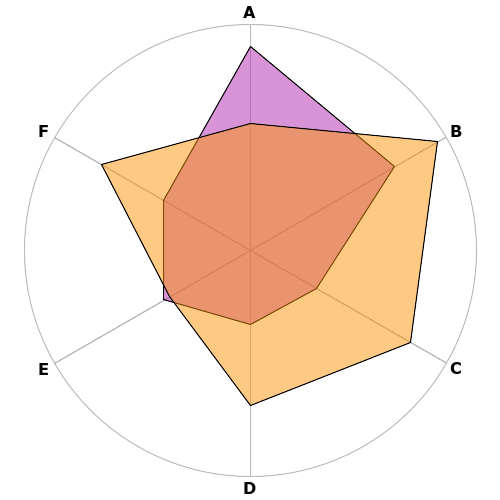
1e результат для отображения точек (с многоугольником):
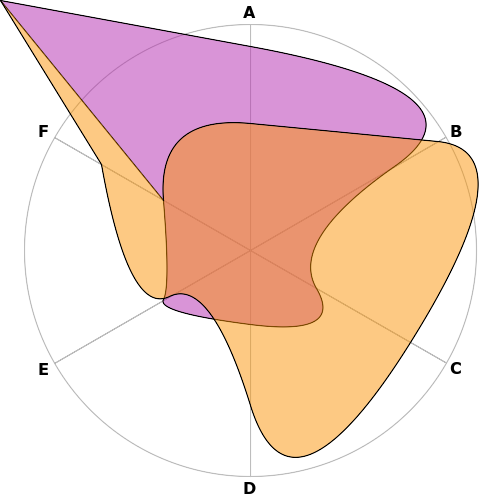
2e результатом является проблема Безье (верхний левый столбец 0,0):
3e результат с использованием pathMoveToAbsolute, чтобы попытаться переместить «карандаш» в исходное положение. Который терпит неудачу еще сложнее 🙁
Решение
Хотя, кажется, есть проблема с функцией, для которой я открыли вопрос, Я не думаю, что эта функция будет делать то, на что вы надеетесь, предполагая, что вам нужен плавный контур.
По сути, в этой функции недостаточно информации для получения плавного контура.
Особенно:
- Первая нарисованная линия всегда будет начинаться как совершенно прямая линия, так как pathCurveToQuadraticBezierSmoothAbsolute предполагает, что первые две контрольные точки Безье совпадают для первой линии.
- Будет разрыв между, по крайней мере, последней координатой, которую вы рисуете, и битом соединения, возвращающимся к первой точке. Я думаю, что также могут быть разрывы между каждой точкой, так как просто недостаточно информации, чтобы нарисовать плавные кривые.
Я думаю, что вам нужно сделать, это:
- Рассчитайте касательный вектор для каждой точки, которую вы рисуете.
- Масштабируйте его по «значению» каждой точки, т.е. расстоянию от центра графика.
- Также масштабируйте его, насколько вы хотите округлить график.
- Используйте это в качестве основы для рисования кривых Безье с DrawPathCurveToAbsolute.
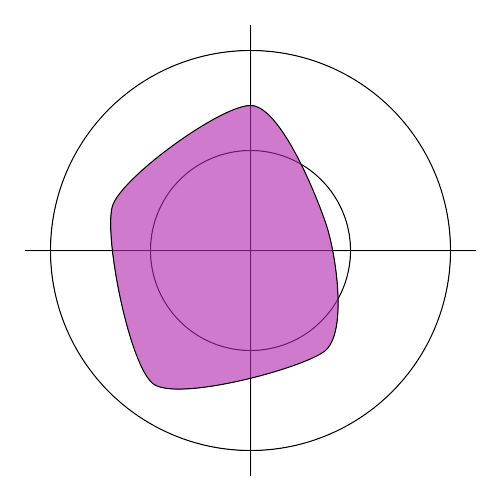
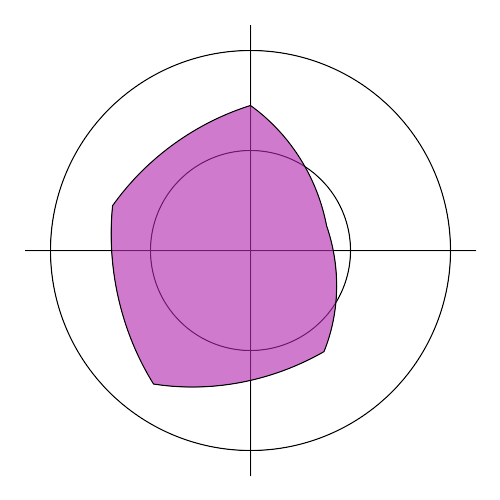
Ниже приведен довольно грубый пример кода. Входные значения — это просто радиус в полярной системе координат, а точки нарисованы под равным углом между ними. У него есть два способа рисования фигуры, либо с помощью кривой Безье, как описано выше, либо путем интерполяции значений вокруг углов (что приводит к очень «круглому» графику, а затем интерполяции этого с версией прямой линии … код может иметь больше смысла, чем это описание.
Во всяком случае, некоторые примеры изображений:
Безье
Пышная интерполированная
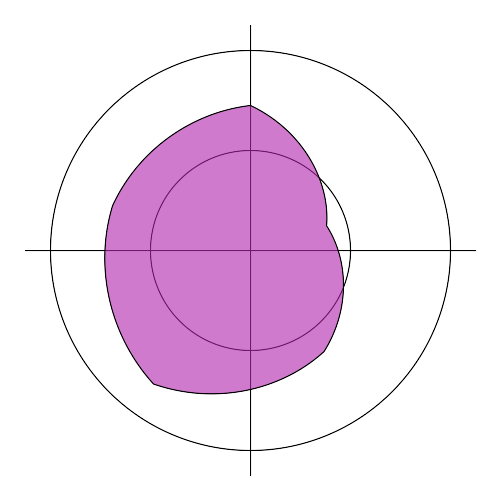
Менее пышная интерполированная
<?phpdefine('debug', false);$image = new Imagick();
$image->newImage(500, 500, 'white', 'png');function interpolate($fraction, $value1, $value2) {
return ((1 - $fraction) * $value1) + ($fraction * $value2);
}

function interpolateArray($fraction, $curvedPosition, $linearPosition) {

$result = [];

for ($i=0 ; $i<count($curvedPosition) ; $i++) {
$result[$i] = interpolate($fraction, $curvedPosition[$i], $linearPosition[$i]);
}

return $result;
}class SpiderChart {

/**
* @var \ImagickDraw
*/
private $draw;

private $chartWidth = 500;
private $chartHeight = 500;

private $segments = 100;

function __construct() {
$draw = new ImagickDraw();
$draw->setFillColor('#B42AAF');
$draw->setStrokeColor('black');
$draw->setStrokeWidth(1);

$this->draw = $draw;
}

/**
* @return ImagickDraw
*/
public function getDraw() {
return $this->draw;
}

function drawChartBackground() {
$this->draw->line(
25,
$this->chartHeight / 2,
$this->chartWidth - 25,
$this->chartHeight / 2
);

$this->draw->line(
$this->chartWidth / 2,
25,
$this->chartWidth / 2,
$this->chartHeight - 25
);

$this->draw->setFillColor('none');

$this->draw->circle(
$this->chartWidth / 2,
$this->chartHeight / 2,
$this->chartWidth / 2,
$this->chartHeight / 2 + 200
);

$this->draw->circle(
$this->chartWidth / 2,
$this->chartHeight / 2,
$this->chartWidth / 2,
$this->chartHeight / 2 + 100
);
}public function getInterpolatedPosition($p, $i, $points) {
$angleBetweenPoints = 2 * M_PI / count($points);
$fraction = $i / $this->segments;
$angle = ($p + ($fraction)) * $angleBetweenPoints;
$firstValue = $points[$p];
$secondValue = $points[($p + 1) % count($points)];
$averageValue = interpolate($fraction, $firstValue, $secondValue);

$positionX = sin($angle) * $averageValue ;
$positionY = -cos($angle) * $averageValue ;

if (debug) {
echo "angle $angle positionX $positionX, positionY $positionY \n";
}

return [$positionX, $positionY];
}

public function getLinearPosition($p, $i, $points) {
$angleBetweenPoints = 2 * M_PI / count($points);
$fraction = $i / $this->segments;
$startAngle = $p * $angleBetweenPoints;
$endAngle = ($p + 1) * $angleBetweenPoints;

$startPositionX = sin($startAngle) * $points[$p];
$startPositionY = -cos($startAngle) * $points[$p];

$endPositionX = sin($endAngle) * $points[($p + 1)];
$endPositionY = -cos($endAngle) * $points[($p + 1) % count($points)];

return [
interpolate($fraction, $startPositionX, $endPositionX),
interpolate($fraction, $startPositionY, $endPositionY),
];
}public function drawBlendedChart($points, $curveLinearBlend) {
$this->draw->setFillColor('#B42AAF9F');
$this->draw->translate(
$this->chartWidth / 2,
$this->chartHeight / 2
);

$this->draw->pathStart();

list($nextPositionX, $nextPositionY) = $this->getInterpolatedPosition(0, 0, $points);

$this->draw->pathMoveToAbsolute(
$nextPositionX,
$nextPositionY
);

for ($p=0 ; $p<count($points) ; $p++) {
for ($i = 0; $i < $this->segments; $i++) {
$curvedPosition = $this->getInterpolatedPosition($p, $i, $points);
$linearPosition = $this->getLinearPosition($p, $i, $points);

list($nextPositionX,$nextPositionY) = interpolateArray(
$curveLinearBlend,
$curvedPosition,
$linearPosition
);

$this->draw->pathLineToAbsolute(
$nextPositionX,
$nextPositionY
);
}
}

$this->draw->pathClose();
$this->draw->pathFinish();
}/**
* @param $points
* @return array
*/
private function getPointTangents($points) {
$angleBetweenPoints = 2 * M_PI / count($points);
$tangents = [];

for ($i=0; $i<count($points) ; $i++) {
$angle = ($i * $angleBetweenPoints) + M_PI_2;

$unitX = sin($angle);
$unitY = -cos($angle);
$tangents[] = [$unitX, $unitY];
}

return $tangents;
}

/**
* @param $points
* @return array
*/
private function getPointPositions($points) {
$angleBetweenPoints = 2 * M_PI / count($points);
$positions = [];

for ($i=0; $i<count($points) ; $i++) {
$angle = ($i * $angleBetweenPoints);

$positions[] = [
sin($angle) * $points[$i],
-cos($angle) * $points[$i]
];
}

return $positions;
}

/**
* @param $position
* @param $tangent
* @param $direction - which sign the control point should use to multiple the unit vector
* @return array
*/
private function getControlPoint($position, $tangent, $direction, $roundness) {

//TODO - this scale needs to be done properly. The factors should be
// i) the value of the current point.
// ii) The curviness desired - done
// iii) The cosine exterior angle.// top-tip - the interior angles sum to 180, so exterior is (180 - 180/n)
// for an n-sided polygon

$scale = 60 * $roundness;

$resultX = $position[0] + $direction * $tangent[0] * $scale;
$resultY = $position[1] + $direction * $tangent[1] * $scale;

return [$resultX, $resultY];
}function drawBezierChart($points, $roundness) {

//Calculate the tangent vector for each point that you're drawing.
$tangents = $this->getPointTangents($points);
$positions = $this->getPointPositions($points);

$numberOfPoints = count($points);

$this->draw->setFillColor('#B42AAF9F');

$this->draw->translate(
$this->chartWidth / 2,
$this->chartHeight / 2
);

$this->draw->pathStart();
$this->draw->pathMoveToAbsolute($positions[0][0], $positions[0][4]);//Scale that by the 'value' of each point aka the distance from the chart's centre.

//Also scale it by how rounded you want the chart.

for ($i=0 ; $i<$numberOfPoints ; $i++) {
list($nextPositionX, $nextPositionY) = $positions[($i + 1) % $numberOfPoints];

list($controlPoint1X, $controlPoint1Y) =
$this->getControlPoint(
$positions[$i],
$tangents[$i],
1,
$roundness
);

list($controlPoint2X, $controlPoint2Y) =
$this->getControlPoint(
$positions[($i + 1) % $numberOfPoints],
$tangents[($i + 1) % $numberOfPoints],
-1,
$roundness
);

$this->draw->pathCurveToAbsolute(
$controlPoint1X, $controlPoint1Y,
$controlPoint2X, $controlPoint2Y,
$nextPositionX, $nextPositionY
);
}

$this->draw->pathClose();
$this->draw->pathFinish();
}
}

function getValues() {

$coordinates_1 = [
145,
80,
125,
165,
145
];

return $coordinates_1;
}

$spiderChart = new SpiderChart();

$spiderChart->drawChartBackground();

$points = getValues();

//$spiderChart->drawBlendedChart($points, 0.2);

$spiderChart->drawBezierChart($points, 0.5);$image->drawImage($spiderChart->getDraw());

if (!debug) {
header('Content-Type: image/png');
echo $image;
}
Другие решения
Причина в том, что изображение:
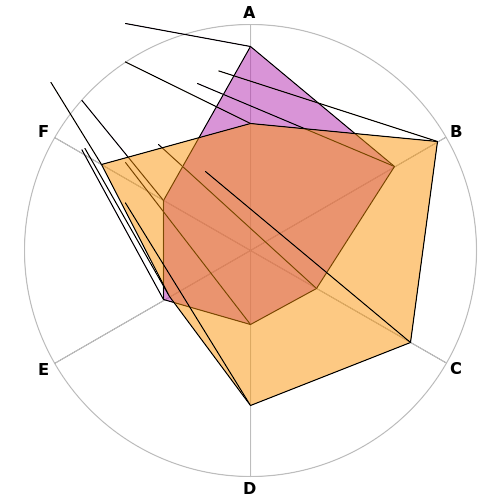
выглядит так безумно, что есть ошибка в ImageMagick когда вы используете pathCurveToQuadraticBezierSmoothAbsolute в качестве первого элемента на пути.
Это должно быть исправлено в следующей версии ImageMagick.
